THE ICONIC is a leading online fashion and sports retailer in Australia, founded in 2011. Based in Sydney, the company offers a wide selection of clothing, shoes, accessories, and sports gear from a variety of popular brands.
The company helped revolutionize the Australian fashion market by allowing people to shop at any time of the day and offering lighting fast delivery services in the most important Australian cities. I was lucky enough to be part of the early stage of the company.

Introduction
Background
After working on almost every aspect of the user experience from the messages used in the marking channels to the final aspect of the deliveries, we realized that the most important aspect that we haven’t worked on was which garments were presented to the users when they were first landing on a catalog page (think the long list of garments). We quickly realized that it was at the core of every member experience and that we had overlooked one of the key aspects of the user shopping journey by simply relying on out-of-the-box solutions and human reviews.
Methodology
By re-examining the fundamentals of catalog sorting we came up with 3 criteria
- Importance score
The likelihood for a new item to perform is based on multiple criteria, like brand, item category or seasonality, and pricing. - Performance score
The actual performance of an SKU based on the data collected on the users’ interactions – Click Through Rate % (how many people clicked on it divided by the number of times the product was displayed), Conversion Rate % (how many people purchased the item after clicking on it), and the Revenue generated for a given product. - Size score
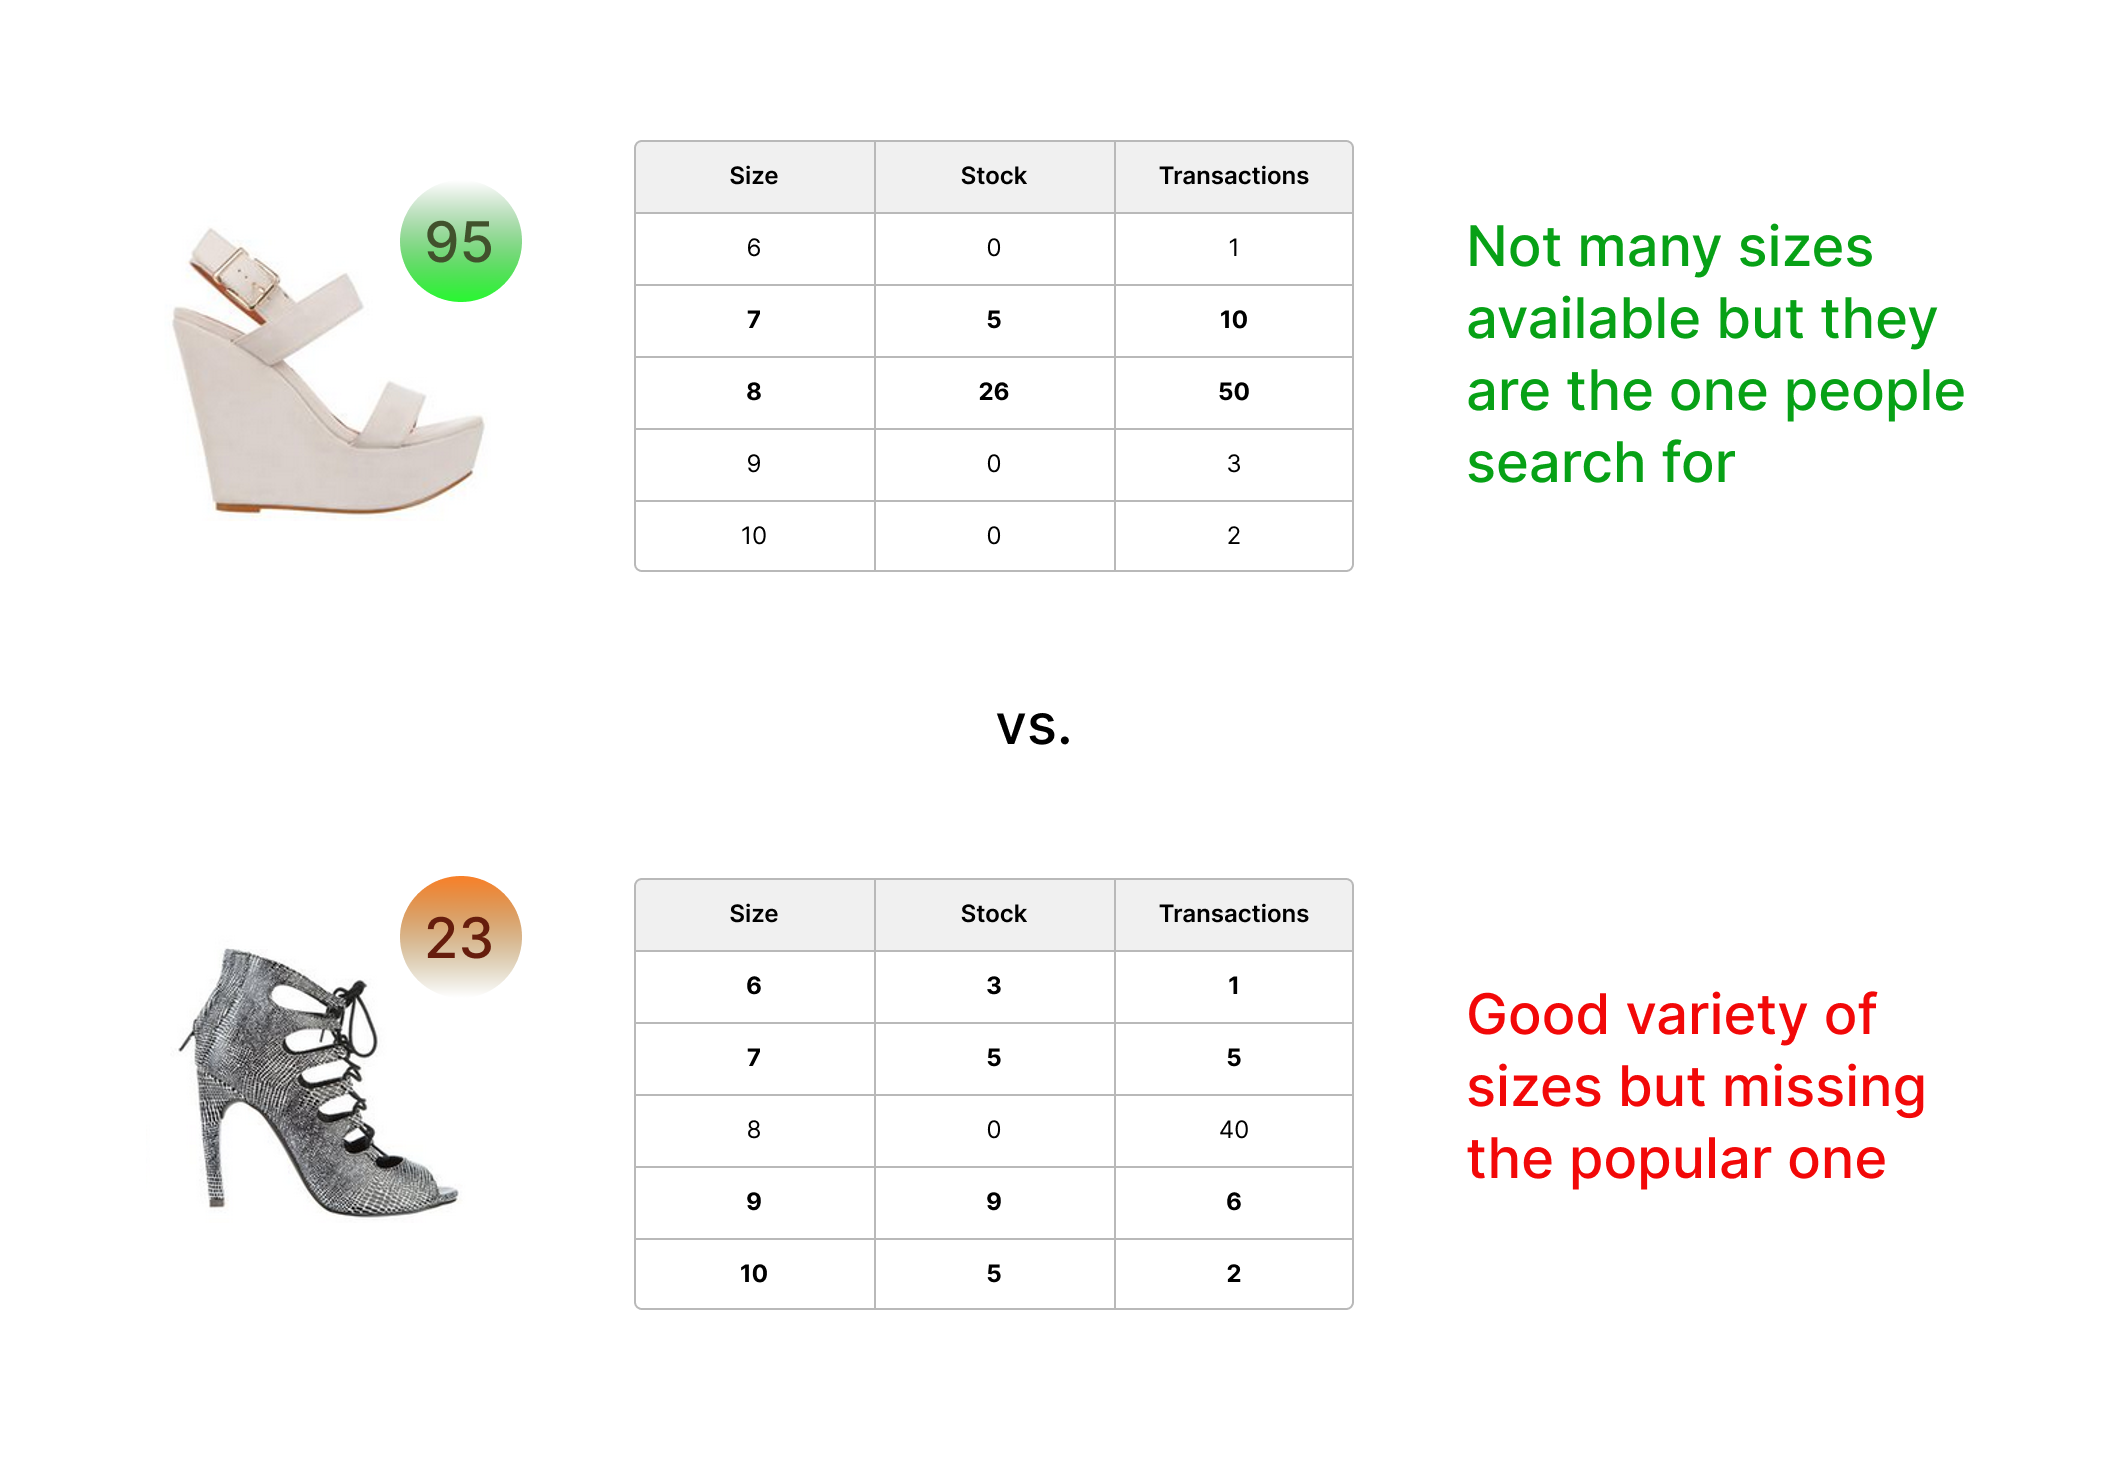
In order to make sure that we would display products that were still available to our customers we would also focus on the sizing distribution of each item – prior to the change we would look at how many sizes were still available for a given SKU, after the change we would give more importance to the most popular sizes and penalized the SKU with only extreme/edge sizes availability.
The size score would apply to any SKU disregarding if they are new or not on the live site

Figure 1 – Size scores between 2 items
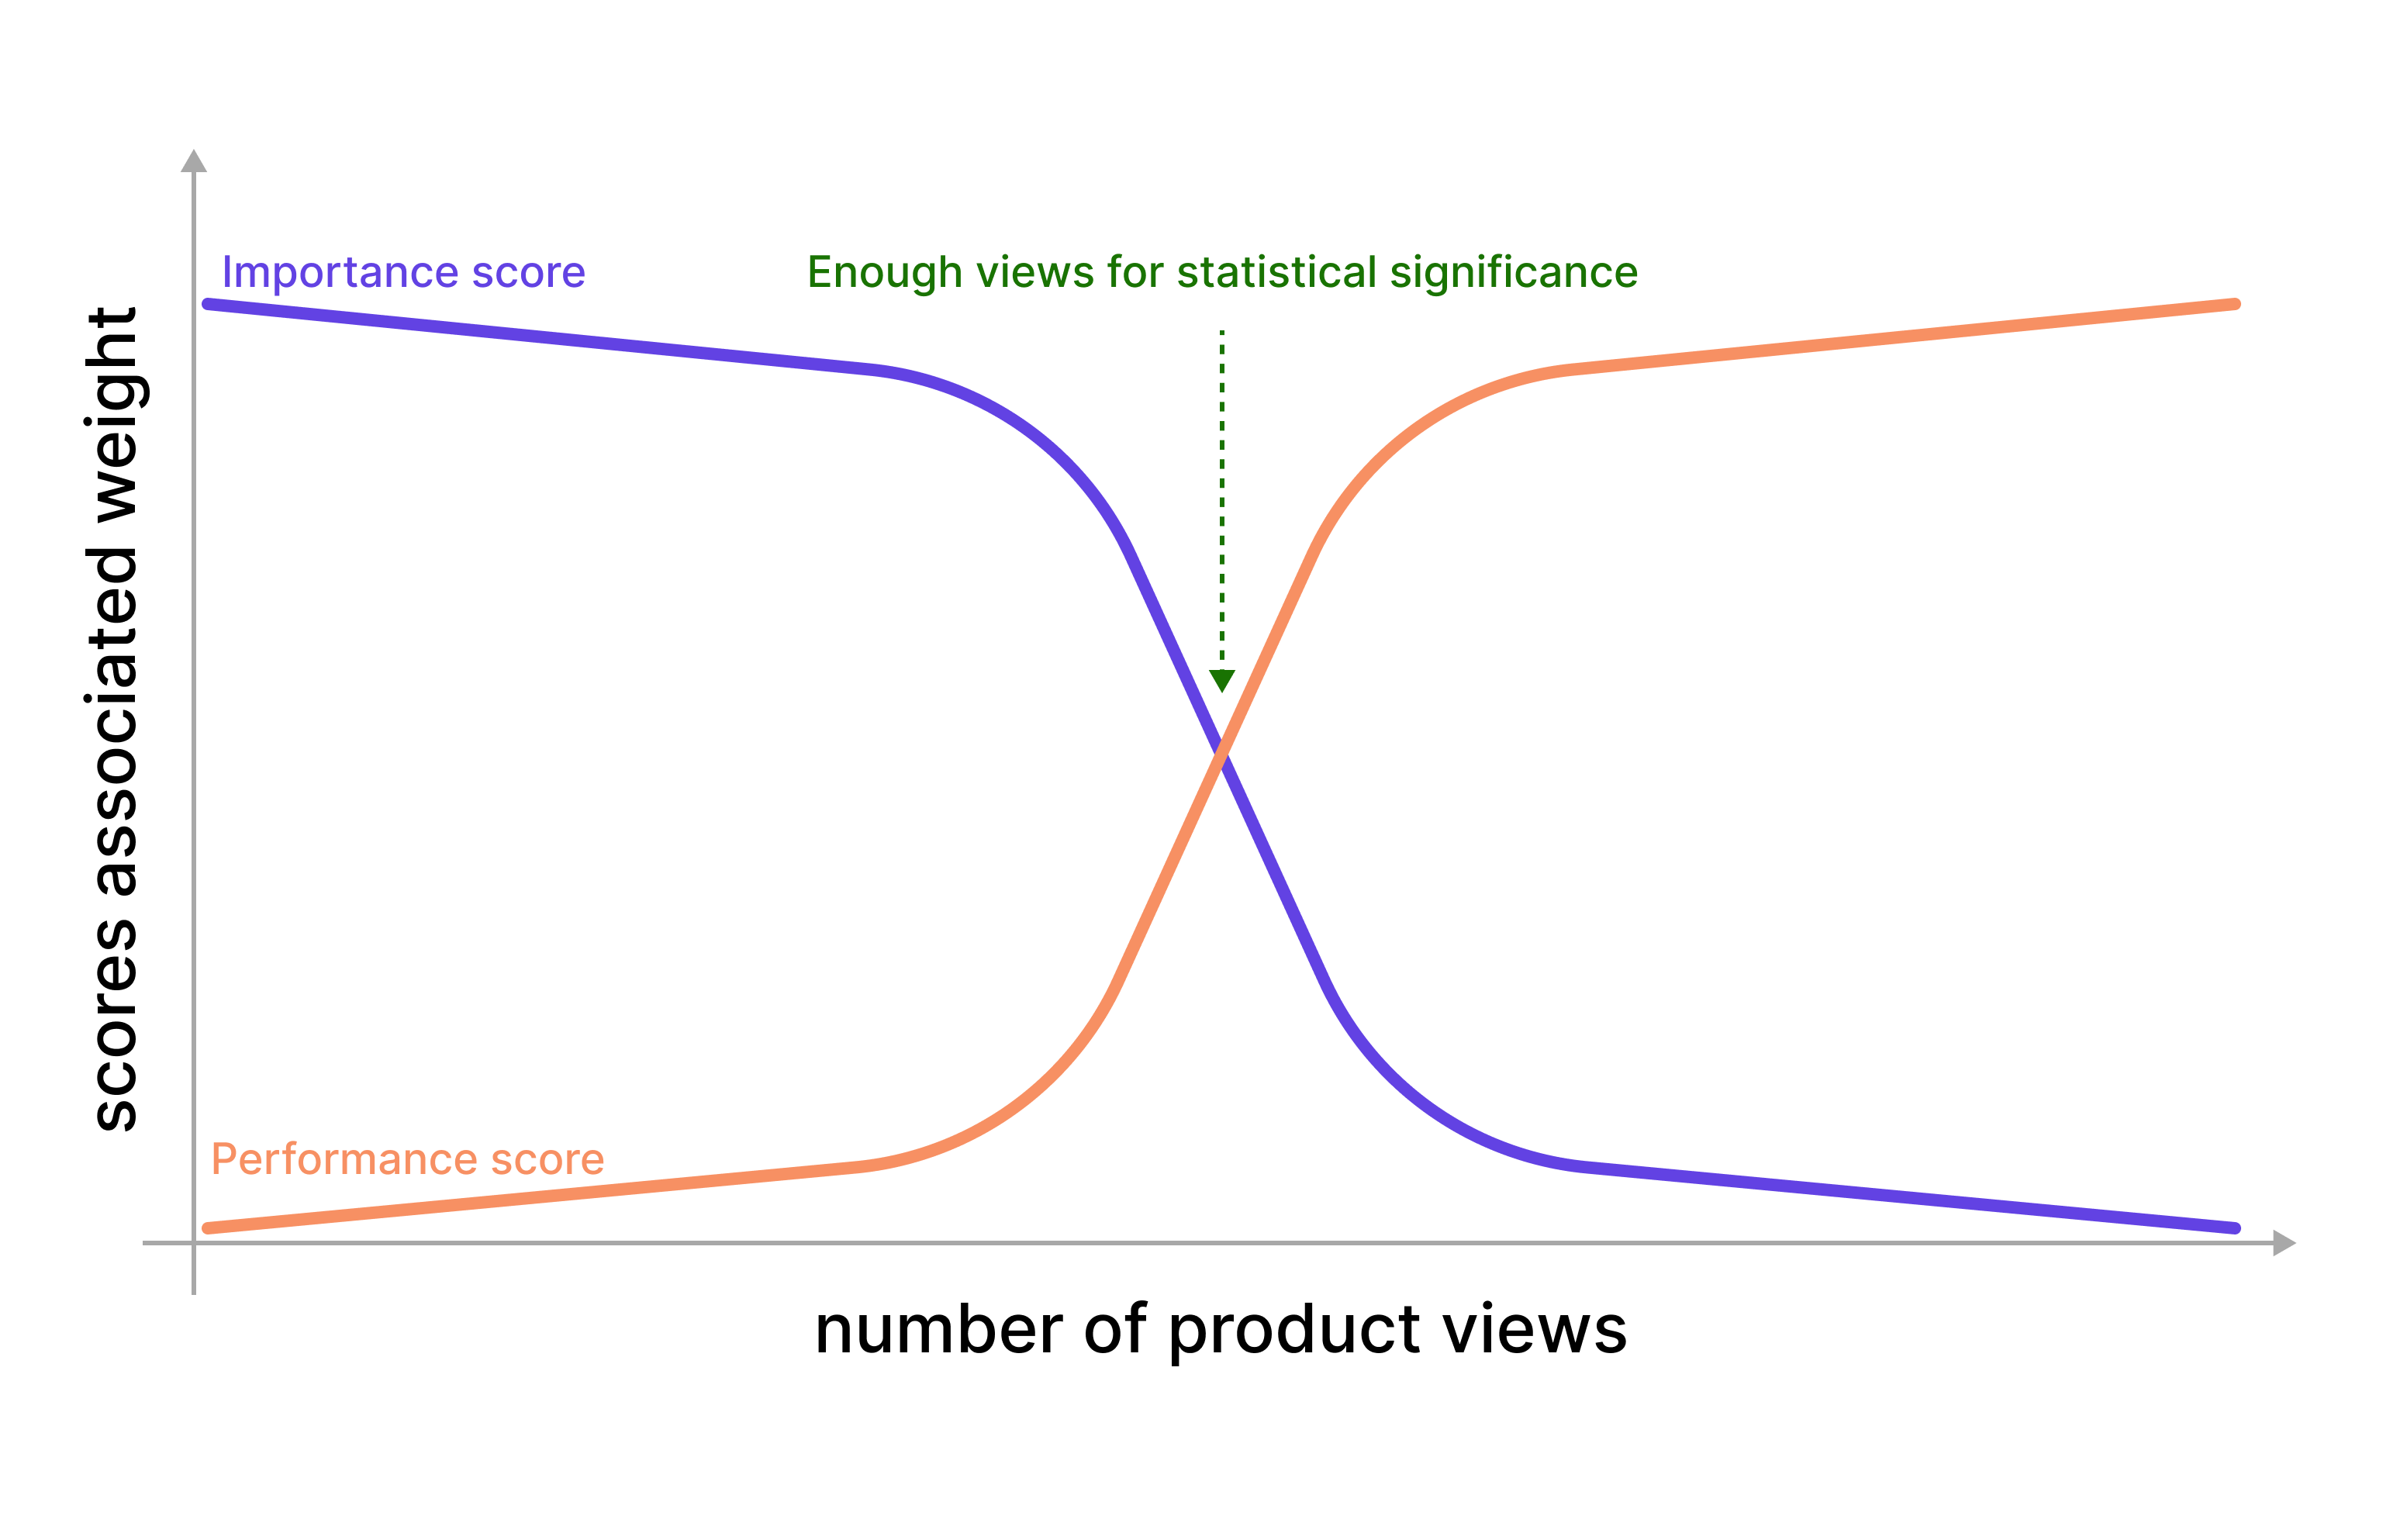
We then created a way to link all these concepts together. We decided to give any new product enough time to be seen on the website and give a sense of freshness to frequent visitors. Meaning the importance score would have more weight than the performance score up to a certain number of views. Then the performance score will be given more importance until the item was finally retired or its size score reached 0.
A visual representation of the weight switch between the importance and performance scores of a given style based on the number of views it received can be seen in Figure 2.

Figure 2 – Weight of Importance and product scores based on number of product views
Results
A staggering +$15M was added to the company’s bottom line when the new catalog sorting algorithm was deployed to the live site. A fair chance was given to all items, the need for human intervention was removed, and a sense of newness/freshness was perceived by the most frequent users of the site.
